Experience Measurement -Why and What
Measurement Versus Metrics
Perhaps, you are wondering how you can show the value of your customer and user experience improvements. In this article, I’ll distinguish between measurements and metrics, highlighting that metrics are goal-oriented and not limited to numerical values. I’ll emphasize the importance of metrics in evaluating product design effectiveness and tracking performance over time, and delve into the various types of UX metrics to enhance user experiences.
Two Categories of Metrics:
Metrics can be categorized into two main groups: behavioral and attitudinal. These categories help us gain a deeper understanding of how users experience a product.
Behavioral Metrics Examples:
Time on Task:
Measures the time users spend completing specific activities.
Essential for task-focused activities where efficiency is key, such as online shopping checkout processes.
Average Session Length:
Indicates user engagement by measuring the time spent within the app.
Longer sessions generally signify higher user engagement and satisfaction.
Abandonment Rate:
The ratio of abandoned purchase attempts to initiated transactions.
Critical for e-commerce platforms, as a high abandonment rate may signal issues with the checkout process.
Error Rate:
Quantifies the number of user errors while performing tasks.
Often linked to usability problems, helping identify areas for improvement.
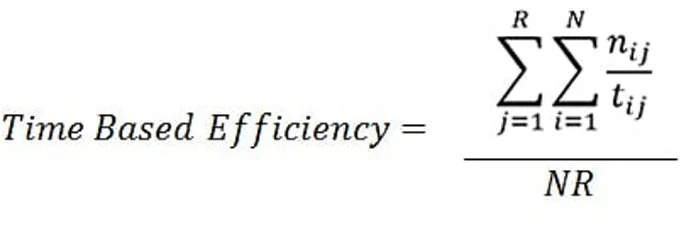
Efficiency is a complex metric to monitor as it relies on a formula and is assessed using other metrics, particularly the "Success rate" and "Time per task." ~Source
Attitudinal Metrics Examples:
Daily/Monthly Active Users (DAU/MAU):
Measures the ratio between your daily active users and your monthly active users e.g. apps over 20% are considered good.
Higher engagement is indicated when DAUs exceed new user numbers.
Net Promoter Score (NPS):
Gauges user loyalty and satisfaction through a single-question survey.
Categorizes users as promoters, passives, or detractors, providing insights into a score to compare e.g. anything over 0 is considered good.
Can be converted into a System Usability Score through a regression model.
Customer Satisfaction Score (CSAT):
Assesses user satisfaction with specific interactions or experiences.
Useful for pinpointing areas of improvement within the product.
Customer Effort Score(CES):
Focuses on how easy or difficult it was to complete a task.
Reveals the usability of specific products and journeys.
System Usability Scale (SUS):
Utilizes a set of questions to evaluate usability and ease of use.
Offers valuable insights into user satisfaction and usability.
Can be used as part of the Happiness, Engagement, Adoption, Retention and Task Success (HEART) Framework.

Choosing the Right Metrics:
From what I’ve observed over the years, many companies want to measure metrics but they don’t spend the time picking the right ones and creating a governance process to ensure that they are consistently being tracked and socialized out to other teams.
First, it’s critical to choose the appropriate metrics for your project depends based on your business model and key performance indicators (KPIs). Start by understanding what aspects of your product impact your bottom line. Then, choose metrics that align with your objectives. This could be usage rates for new products and/or features post-launch. Note, it is not uncommon to experience a dip in certain behavioral metrics like time on task right after a launch as users are trying to learn the new UI pattern.
Remember to link your selected metrics to design decisions and track them through the customer journey such as collecting high satisfaction scores during the shopping experience but low scores during checkout. This is not just about accountability but it helps you diagnose the root cause of the problem.
Track changes over time and benchmark against previous iterations. Data can reveal what is happening, but qualitative research, like user interviews and contextual inquiries, helps you flesh out why it's happening. Combining metrics with qualitative insights paints a comprehensive picture of your product's performance.